Q1. What Is AI SOC ROI, and Why Should You Measure It as a Category Before Picking a Vendor?
AI SOC ROI is the measurable financial return your organization gets when it replaces, or augments, traditional security operations with AI-driven detection, triage, investigation, and response. Not “value” in the vague, marketing-deck sense. Hard dollars: analyst hours recovered, breaches contained faster, operational overhead eliminated.
The Numbers Are Already Clear
IBM’s 2025 Cost of a Data Breach Report puts it plainly: organizations using AI and automation extensively across their SOC saved nearly $1.88 million per breach, bringing their average cost down to $3.62 million versus $5.52 million for those without. The global average breach cost dropped from $4.88M in 2024 to $4.44M in 2025, and faster AI-driven detection was the primary driver. AI SOC is no longer a feature bolted onto a legacy SIEM. It is a defined category, with its own cost structure, delivery models, and ROI profile.
Why Category-First Thinking Changes the Outcome
Here is where most buyers go wrong: they jump straight to vendor demos. They compare Vendor A’s dashboard against Vendor B’s integration list, without first answering a more fundamental question: What is the maximum theoretical ROI an AI SOC can deliver for my specific environment, given my alert volume, analyst headcount, and breach risk profile?
That number is vendor-independent. It is the ceiling. Once you know it, every vendor conversation becomes a data-driven negotiation instead of a features contest. You are asking, “How close to that ceiling can you get me, and at what cost?” instead of “Show me something impressive.” This is how you make vendor selection a math problem, not a relationship problem.
What This Article Covers
The framework laid out here walks through each component of that math:
- The core ROI formula with a fully worked example you can replicate
- Analyst efficiency metrics with the first aggregated benchmarks table compiling IBM, Ponemon, Forrester, and vendor-published data in one place
- Breach cost avoidance modeling, separated from cost savings, the way your CFO actually thinks about it
- AI SOC vs. traditional SOC economics, side-by-side
- Autonomous vs. human-assisted delivery models and their ROI implications
- A vendor feature → ROI driver mapping matrix
- TCO with hidden costs, and a CFO-ready business case template with sensitivity analysis
No vendor is pushed. The framework makes the right choice self-evident.
Q2. How Do You Calculate the ROI of an AI SOC? (The Core Formula With a Worked Example)
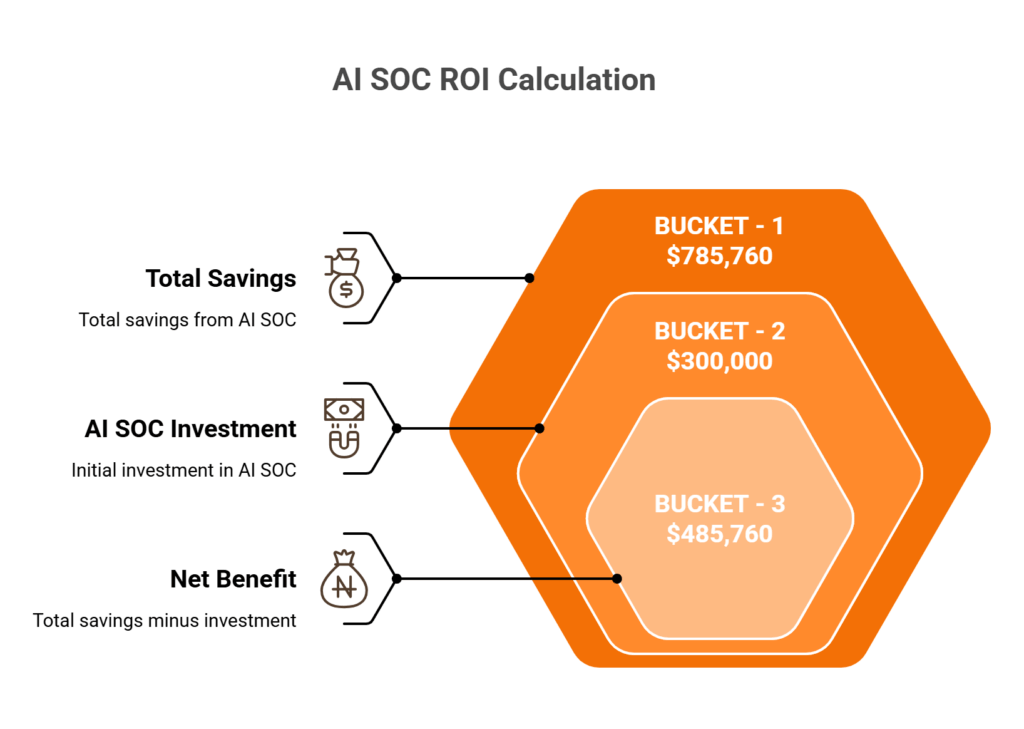
Every ROI conversation starts with the same formula. The difference between a credible business case and a slide-deck guess is whether you can show your work. Here is the three-bucket model that Vectra, Simbian, and Dropzone all reference in fragments, but none of them walks through all three buckets with replicable numbers. This section does.
The Master Formula
AI SOC ROI (%) = [(Analyst Efficiency Savings + Breach Cost Avoidance + Operational Savings) − Total AI SOC Investment] / Total AI SOC Investment × 100
Each variable maps to a specific, auditable data source inside your organization. No black boxes.
💰 Bucket 1: Analyst Efficiency Savings
This is the most tangible bucket, the one your finance team will validate fastest.
Formula: Hours saved per analyst per day × Fully loaded hourly cost × Analyst count × 260 working days
The benchmarks to anchor your estimate:
| Input | Range | Source |
|---|---|---|
| Tier-1 SOC analyst salary (US) | $60K–$99K (avg. ~$99K fully loaded) | ZipRecruiter 2025 |
| Tier-1 alert handling automated by AI | 70–90% | Simbian, Dropzone |
| Time saved per analyst per day | 3–5 hours | Industry consensus |
Worked example: 8 analysts × 4 hrs saved/day × $48/hr (based on ~$99K loaded) × 260 days = $399,360/year
If you are in a high-cost market (California, New York, DC), push that hourly rate to $60+ and the number climbs past $500K.
💰 Bucket 2: Breach Cost Avoidance
Formula: Annual breach probability × Average breach cost × Risk reduction factor from AI SOC
IBM’s 2025 data: $4.44M global average breach cost; organizations with extensive AI and automation cut that to $3.62M; average breach lifecycle dropped to 241 days, the lowest in nearly a decade. Shadow AI incidents add a $670K premium per event.
Worked example: 15% annual breach probability × $4.44M × 40% risk reduction = $266,400 annualized avoidance
💰 Bucket 3: Operational Savings
This bucket is environment-specific, so instead of fabricating a universal number, here is the audit checklist:
- ✅ Reduced SIEM/SOAR licensing overlap (consolidation savings)
- ✅ Lower overtime and on-call compensation
- ✅ Decreased contractor and staff augmentation spend
- ✅ Compliance penalty avoidance (audit prep automation)
- ✅ Reduced threat intelligence subscription costs (some AI SOCs bundle TI feeds)
For the worked example, a conservative estimate of $120,000 across these line items.
✅ The Combined ROI
($399,360 + $266,400 + $120,000) − $300,000 AI SOC investment = $485,760 net benefit → 162% ROI
⚠️ These are illustrative. Plug in your own numbers. The sensitivity analysis in Q9 will show you how the result shifts when breach probability and analyst utilization change, because those two inputs carry the most variance.
Q3. Which Analyst Efficiency Metrics Actually Prove AI SOC Value? (With Aggregated Industry Benchmarks)
If you have run a SOC, or tried to justify one to a board, you know that “we’re faster now” does not survive a finance review. You need specific metrics, tied to specific benchmarks, with before-and-after baselines. The problem is that the benchmarks are scattered across half a dozen sources. So here, for the first time, is a consolidated reference table pulling from IBM, Ponemon, Forrester, Gartner, Gurucul, and vendor-published proof-of-concept data, all in one place.
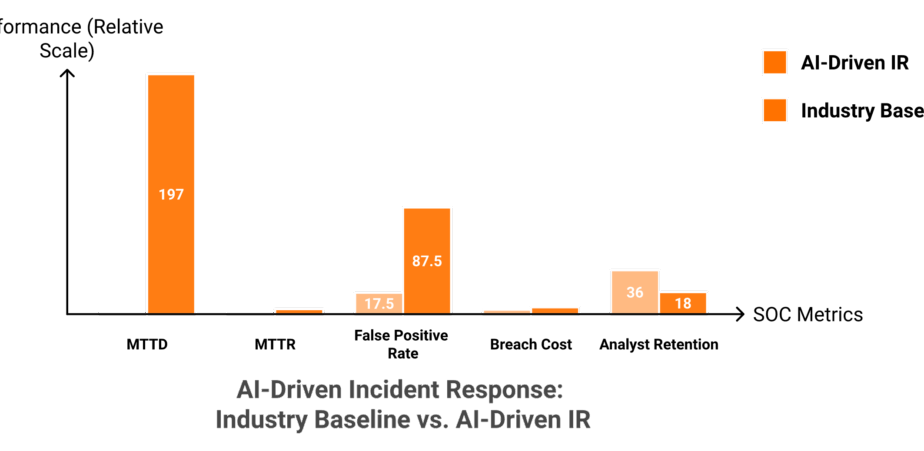
The Six Metrics That Map to ROI
| Metric | Traditional SOC | AI SOC | Source |
|---|---|---|---|
| MTTD (Mean Time to Detect) | Hours to 197+ days | < 10 minutes | IBM 2025; Prophet Security |
| MTTR (Mean Time to Respond) | 60–90 minutes | < 15 minutes | Palo Alto Forrester TEI: 85% MTTR reduction |
| MTTI (Mean Time to Investigate) | 25–45 min/alert | ~4.3 minutes | Prophet AI PoC at 40K-person healthcare org |
| Cost per Alert | $15–$35 (manual) | $1–$5 (AI-automated) | Dropzone AI; Simbian |
| False Positive Reduction | 50–70% FP rate | Up to 90% reduction | Gurucul 2025 survey; Simbian |
| Analyst Force Multiplier | 1x | 3–10x | Palo Alto Forrester TEI; Dropzone |
Why MTTI Is the Metric Most People Miss
Most articles tracking SOC efficiency focus on MTTD and MTTR. They skip investigation time, which is where analysts actually spend 60–80% of their workday. Prophet AI’s proof-of-concept at a 40,000-person healthcare organization measured a 4.3-minute mean time to investigate, with 19 days of analyst time saved and 92% of alerts automatically resolved. That investigation collapse is what drives Bucket 1 of the ROI formula. If your AI SOC does not measurably reduce MTTI, you will not see the analyst efficiency gains on paper.
Analyst Retention: The “Soft” Metric That Shows Up on the P&L
Palo Alto Networks’ Forrester TEI study documented a 244% ROI over three years, with alert volume requiring Tier 1 attention dropping by 85% and analyst time freed for strategic work like threat hunting. When analysts stop drowning in false positives, they stay. The cost of replacing one SOC analyst runs 50–200% of their annual salary when you factor in recruiting, clearance processing, ramp-up time, and institutional knowledge loss.
“AI-driven automation alleviates alert fatigue, allowing analysts to focus on strategic tasks like threat hunting, improving job satisfaction and retention.”
— Forrester TEI for Cortex XSIAM, 2025
Track your annual SOC turnover rate before and after AI SOC deployment. That delta, multiplied by replacement cost per analyst, is a line item under Bucket 3 (Operational Savings) in your ROI model. It is not the headline number, but for organizations losing 2–3 analysts a year at $99K+ each, it adds up fast.
Q4. How Do You Model Breach Cost Avoidance, and Why Is It Different From Cost Savings?
This is the section that will make or break your business case with finance leadership. Cost savings and cost avoidance are not the same thing, and most AI SOC ROI articles treat them interchangeably. Your CFO does not.
The Distinction That Earns CFO Trust
Cost savings = real dollars you stop spending. You had 8 analysts pulling overtime; now AI handles triage and overtime drops by 60%. That is a line item that shows up on the income statement.
Cost avoidance = dollars you never lose because an incident was prevented or contained faster. You did not have a $4.44M breach because your MTTD went from days to minutes. That number never appears on the income statement, but it absolutely affects risk exposure and insurance premiums.
CFOs treat these differently in financial modeling. Conflating them in a single “ROI” line makes your entire case look unsophisticated. Separate them, and you speak finance’s language.
⚠️ The Counterfactual Model: “What Would Have Happened?”
Breach cost avoidance requires counterfactual reasoning, modeling the outcome you avoided. The inputs come from IBM’s 2025 report:
- Global average breach cost: $4.44M (down from $4.88M in 2024)
- U.S. average: $10.22M
- Healthcare average: remains the highest-cost vertical
- AI-extensive organizations saved ~$1.88M per breach
- Shadow AI incidents add $670K premium
- Average breach lifecycle: 241 days, the lowest in nearly a decade
Avoidance formula:
(Estimated annual breach incidents × Avg. breach cost) − (Same incidents × Reduced breach cost with AI SOC) = Annual breach cost avoidance
Three-Tier Scenario Analysis
Breach probability is the highest-variance input. Instead of picking one number, model three scenarios and let leadership choose their comfort level:
| Scenario | Breach Frequency | Cost Reduction | Annualized Avoidance |
|---|---|---|---|
| 🟢 Conservative | 1 breach / 3 years | 30% | ~$444K |
| 🟡 Moderate | 1 breach / 2 years | 40% | ~$888K |
| 🔴 Aggressive | 1 breach / year | 50% | ~$2.22M |
For U.S.-based organizations, swap $4.44M for $10.22M and these numbers roughly double.
The Dwell Time Dividend
Faster detection does not just reduce cost linearly; it changes the cost curve. IBM’s data consistently shows that breaches contained under 200 days cost approximately $1.02M less than those exceeding 200 days. AI SOC collapses MTTD from days or weeks to minutes, which means you are not just detecting faster. You are shifting your entire organization onto a fundamentally lower cost curve.
This dwell time dividend should be modeled separately from the scenario analysis above because it compounds the avoidance number regardless of which tier you choose.
📋 Your 5-Input Template
Gather these from your environment and plug them into the formula:
- Historical incident count (last 3 years, annualized)
- Average incident cost (internal data or IBM benchmark for your vertical)
- Current mean containment time (your MTTD + MTTR today)
- AI SOC’s projected containment time (vendor SLA or benchmark from Q3 table)
- Annual AI SOC cost (platform + integration + ongoing)
The output is your Bucket 2 line item from the master formula in Q2. Pair it with the sensitivity analysis in Q9, and you have a breach cost avoidance number that your CFO can audit, stress-test, and trust.
Q5. AI SOC vs. Traditional SOC: What Do the Hard ROI Numbers Actually Show?
This is not a “good versus bad” comparison. It is a comparison of economic models, and those models have fundamentally different ROI ceilings.
Three Economic Models, Three Cost Curves
A traditional SOC is headcount-driven. Every incremental unit of coverage (more hours, more alerts, more tools) requires another analyst hire. Costs scale linearly. A legacy MSSP outsources that headcount but does not change the model. You are still paying per-human, and those humans are often forwarding alerts rather than resolving them.
“Every single day, we receive at least 50 alerts, 99% of which are blocked attack attempts.”
— u/fcsar, r/cybersecurity Reddit Thread
An AI SOC is platform-driven. After the initial investment, each additional alert, endpoint, or log source costs nearly nothing to process. Costs scale sublinearly. That is the structural difference.
💰 The Side-by-Side Numbers
| Dimension | Traditional SOC (In-House) | Legacy MSSP | AI SOC |
|---|---|---|---|
| Annual cost for 24/7 coverage | $1.5M–$3M+ (8–12 analysts, shifts, benefits) | $500K–$1.2M (outsourced, but still headcount-based) | $200K–$600K (platform + 2–4 analysts) |
| Alert handling capacity | 50–100 alerts/analyst/day | Similar, outsourced humans with same limits | 5,000–50,000+/day automated |
| MTTD | Hours to days | Hours (still human-dependent) | Seconds to minutes |
| MTTR | 30–90 minutes | 30–60 minutes | < 15 minutes |
| Scalability | Hire more analysts | Renegotiate contract, add seats | Marginal cost near zero |
| Coverage gaps | Shift-based; weekends and holidays exposed | Depends on contract tier | True 24/7/365 |
| Cost per resolved incident | $50–$150 | $40–$100 (but “resolved” is debatable) | $5–$20 |
❌ The MSSP “Alert Forwarding” Problem
The cost-per-resolved-incident row deserves a closer look. Traditional MSSPs detect and notify, but they rarely resolve. They send your team 200 alerts a day, often without actionable context, and your analysts still investigate each one.
An AI SOC triages, investigates, and recommends or executes response. The “resolved” part actually happens, which is why the cost-per-resolved-incident comparison is not even close.
⚠️ The Hidden Cost of Staying Put
Staying with a traditional SOC is not just more expensive today; it accumulates security debt. Unaddressed alerts pile up. Off-hours coverage gaps become windows of exposure. Analyst turnover compounds institutional knowledge loss. Each of these is a compounding risk that does not show up on a quarterly cost report but absolutely shows up in breach probability. The AI SOC model is front-loaded: higher Year 1 investment in integration and tuning, but higher long-run operating leverage. Headcount-driven models face the opposite, diminishing returns as alert volumes and complexity grow faster than you can hire.
Q6. 100% Autonomous vs. Human-Assisted AI SOC: Which Delivery Model Delivers Better ROI?
This is the comparison no one on the SERP is making, and it is the one that matters most for your ROI projection. Not all AI SOCs are built the same. The delivery model you choose changes the cost structure, the risk profile, and the realistic ROI ceiling.
Two Poles of the Spectrum
100% Autonomous AI SOC: AI handles detection, triage, investigation, and response end-to-end. No human reviews the decision before action is taken. Some agentic SOC platforms market this as the future.
Human-Assisted AI SOC: AI handles detection, triage, and initial investigation. A human analyst reviews, validates, and approves response actions for high-stakes scenarios. This is the “AI + Human Ally” model.
Most providers sit somewhere between these poles. The question is where on that spectrum your ROI is maximized, and the answer depends on your environment.
💰 Cost Structure Comparison
| Dimension | 100% Autonomous | Human-Assisted |
|---|---|---|
| Cost per alert | ~$2–$8 | ~$5–$15 |
| Platform cost | Higher (more governance, more compute) | Moderate |
| Governance/oversight investment | Significant (audit trails, override protocols) | Lower (human review is built in) |
| Cost of failure (misresponse) | High: production outage, compliance violation | Low: human gate catches edge cases |
The per-alert cost gap looks compelling for autonomous. But factor in the cost of one misresponse, isolating a production server during peak hours, or auto-blocking a legitimate vendor connection, and that gap closes fast.
⚠️ Risk, Accuracy, and the “Confidence Gate”
Autonomous models achieve strong accuracy on known alert types. Simbian reports 92% of alerts resolved autonomously. But the remaining 8% is where the real risk lives: novel threats, business-context decisions, and high-stakes response actions that require judgment.
Orange Cyberdefense frames this clearly: “We won’t have a fully autonomous SOC. We’ll have an augmented battlefield where intelligence, agility, and human oversight are more important than ever.” Eye Security’s SOC research reinforces the same conclusion: analysts still matter for handling ambiguity and organizational context that AI cannot learn from log data alone.
Where Each Model Wins
✅ Autonomous ROI is highest for massive alert volumes, homogeneous cloud-native stacks, and low regulatory complexity. Think a SaaS company running entirely on AWS with standardized endpoints.
✅ Human-assisted ROI is highest for regulated industries (healthcare, finance, PE portfolio companies), complex hybrid environments, and organizations where a single misresponse carries outsized business impact.
The Risk-Adjusted Verdict
For most organizations reading this article, the human-assisted model delivers higher risk-adjusted ROI. The cost of an autonomous misresponse, whether a production downtime event, a compliance violation, or a missed APT that needed human pattern recognition, far exceeds the marginal cost of human review on the 10–20% of alerts that warrant it. The optimal architecture is AI handling 80–90% of volume autonomously, while human concierge analysts handle the high-stakes remainder. This is the AI SOC + Human Ally model, and it is the architecture we built the UnderDefense MAXI platform around, because operational reality demands it.
Q7. Which AI SOC Vendor Features Actually Map to Measurable ROI Drivers?
Now that you have the formula, the metrics, and the delivery model, one question remains: which specific vendor features determine whether that projected ROI actually materializes? Not the features in the marketing brochure, but the ones that move the financial needle.
The Feature → ROI Driver Mapping Matrix
This is the evaluation framework. Score any vendor against it, weighted by your priority levers.
| # | Vendor Feature | ROI Lever It Pulls | Why It Matters |
|---|---|---|---|
| 1 | Vendor-agnostic integration (250+ tools) | Eliminates rip-and-replace costs | Protects your existing SIEM, EDR, and cloud investment |
| 2 | Auto-triage and investigation | MTTI reduction (Bucket 1) | Collapses investigation time from 30+ min to <5 min per alert |
| 3 | Auto-remediation / response playbooks | MTTR reduction + breach avoidance (Bucket 2) | Cuts response time; directly impacts breach cost curve |
| 4 | MITRE ATT&CK coverage (90%+) | Detection effectiveness | Reduces blind spots; fewer missed threats = lower breach probability |
| 5 | Transparent, predictable pricing | TCO certainty | No surprise overages; CFOs can model accurately |
| 6 | Concierge analyst support (human-assisted) | Risk-adjusted ROI | Human review on critical 10–20% prevents costly misresponses |
| 7 | Rapid deployment (<30 days) | Faster payback period | Every month of delayed deployment is a month of unrealized savings |
| 8 | Compliance automation (SOC 2, ISO 27001, HIPAA) | Audit cost reduction | Automated evidence collection saves 100–200 hours per audit cycle |
| 9 | External attack surface monitoring | Proactive risk reduction | Identifies exposures before attackers do; reduces Bucket 2 inputs |
| 10 | Custom detection engineering | Reduced false positives | Environment-specific tuning drives real accuracy, not vendor benchmarks |
💸 The “Integration Tax”: the Single Biggest ROI Killer
When a vendor requires you to rip out your existing SIEM, replace your EDR, or migrate to their proprietary data format, they destroy ROI before deployment begins. That migration cost, including engineering hours, dual-run infrastructure, and data validation, easily reaches $200K–$400K. And you are locked in afterward.
“When I need custom things built, it is very difficult as I am not able to build out custom items to support things that may be specific to my company needs, and I do lose that complete control over my logs.”
— Jenine M., Security Analyst Arctic Wolf – G2 Verified Review
A vendor-agnostic platform layers on top of your existing stack, whether Elastic, Splunk, CrowdStrike, SentinelOne, or Microsoft Sentinel, and delivers incremental ROI from day one. No migration. No dual-run. No lock-in.
✅ How This Maps to UnderDefense
Score any vendor against the 10 features above, weighted by your priority ROI levers. The vendor that scores highest across your priorities is the right choice. We built the UnderDefense MAXI platform around this exact framework: 250+ integrations, transparent pricing ($11–$15/endpoint/month), 30-day onboarding, MITRE ATT&CK coverage, and concierge analyst response. The architecture is designed so the ROI-driving features are not add-ons but the platform itself.
📊 See How the Numbers Work for Your Environment
Get the Full AI SOC Pricing Breakdown, with Cost-Per-Alert, TCO Comparisons, and ROI Projections by Company Size
You’ve built the evaluation framework. Now plug in your numbers. Our 2026 AI SOC Pricing Guide breaks down exact costs across provider tiers, shows what you should expect to pay per endpoint, and maps pricing models to the ROI drivers covered in this article.
Q8. What Does a Complete AI SOC TCO Look Like, Including the Hidden Costs Most Analyses Miss?
Most AI SOC ROI projections are overstated by 20–40%. Not because the savings are fake, but because the investment denominator is incomplete. If you only count the annual platform subscription, you are modeling fantasy. Here is the full picture.
Why Honest TCO Makes Your Case Stronger
Finance teams do not reject AI SOC business cases because the ROI is weak. They reject them because the assumptions look too optimistic. An honest TCO, one that accounts for all five cost layers, survives CFO scrutiny because it shows you have modeled the real world, not the vendor’s demo.
The 5-Layer TCO Framework
| Layer | What It Includes | Typical Range |
|---|---|---|
| 1. Platform/subscription | Annual AI SOC license or managed service fee | $200K–$600K/year (varies by endpoint count) |
| 2. Integration and onboarding | Internal engineering time, data mapping, API configuration, testing | 40–200 hours ($10K–$50K+) |
| 3. Data ingestion/storage | SIEM storage costs that may increase with AI SOC data volume | $20K–$100K+ (GB-based pricing) |
| 4. Tuning and ramp period | First 90 days: lower accuracy, higher human oversight, detection refinement | ~15–25% reduced efficiency in Year 1 Q1 |
| 5. Governance and change management | New workflows, playbook development, team training, process documentation | $15K–$40K |
❌ Three Hidden Cost Traps
Trap 1: Vendor lock-in penalties. Proprietary data formats, long-term contracts, and rip-and-replace architectures create switching costs of $100K–$400K+ if you need to change providers. The migration cost formula is straightforward: engineering hours × loaded rate, plus dual-run infrastructure, plus data migration, plus revalidation, plus a 20% risk buffer.
Trap 2: Compliance coverage gaps. The AI SOC covers detection and response, but audit logging, evidence retention, and regulatory-specific reporting modules may require paid add-ons. If you discover this after signing, it is an unplanned cost that erodes projected ROI.
Trap 3: Escalation overload. If the autonomous model is not tuned properly or the vendor’s AI accuracy is lower than advertised, the human team drowns in escalations. This negates the very efficiency gains you budgeted for in Bucket 1.
✅ Mitigation Strategies
- Against lock-in: choose vendor-agnostic architecture with transparent contracts and no lock-in clauses. UnderDefense’s 30-day onboarding and 250+ integrations are specifically designed to eliminate the integration tax. You keep your SIEM, your EDR, and your data ownership.
- Against compliance gaps: verify that compliance automation covers your specific frameworks (SOC 2, ISO 27001, HIPAA) natively before signing. Ask for the audit evidence export workflow during the evaluation, not after.
- Against escalation overload: set realistic expectations for a 90-day ramp period. Factor reduced Q1 efficiency into Year 1 of your model. Any vendor promising 100% accuracy on day one is selling you something that does not exist.
The Adjusted-ROI Principle
After accounting for all five layers plus hidden costs, a well-structured AI SOC deployment still delivers 100–200%+ ROI over three years. The organizations that fail to realize that ROI share three patterns: they chose a stack-replacement vendor, they underestimated onboarding, or they selected a fully autonomous model for an environment that needed human-assisted oversight. If you model honestly and choose the right architecture, the numbers work.
Q9. How Do You Build a CFO-Ready Business Case and Translate the Numbers for Leadership?
Most AI SOC business cases die in the CFO’s inbox, not because the ROI is weak, but because the presentation speaks SOC instead of finance. A CISO who shows up with “we reduced MTTD by 95%” gets a polite nod. A CISO who shows up with “14-month payback period, $1.6M NPV over three years, positive ROI even under our most conservative breach scenario” gets budget approval.
This section bridges that gap.
💰 The Financial Model Structure
Take the worked example from Q2 and extend it across a 3-year horizon:
| Line Item | Year 0 | Year 1 | Year 2 | Year 3 |
|---|---|---|---|---|
| AI SOC investment (platform + integration + onboarding) | −$380,000 | −$300,000 | −$300,000 | −$300,000 |
| Bucket 1: Analyst efficiency savings | — | $399,360 | $399,360 | $399,360 |
| Bucket 2: Breach cost avoidance | — | $266,400 | $266,400 | $266,400 |
| Bucket 3: Operational savings | — | $120,000 | $120,000 | $120,000 |
| Net annual benefit | −$380,000 | $485,760 | $485,760 | $485,760 |
| Cumulative benefit | −$380,000 | $105,760 | $591,520 | $1,077,280 |
Payback period: ~10 months (cumulative benefit turns positive within Year 1)
3-Year NPV (at 10% WACC discount rate): ~$828,000
3-Year ROI: ($1,077,280 net benefit) / ($1,280,000 total investment) = ~84% cumulative, or 162% annualized on the recurring investment.
The Sensitivity Matrix CFOs Actually Respect
The two highest-variance inputs are breach probability and analyst efficiency improvement. Instead of defending a single projection, present a 3×3 matrix that lets leadership pick their own comfort level:
| 🟢 Conservative Efficiency (2.5 hrs/day) | 🟡 Moderate Efficiency (4 hrs/day) | 🔴 Aggressive Efficiency (5.5 hrs/day) | |
|---|---|---|---|
| Low breach probability (1/3 years) | 14-month payback; 85% 3-yr ROI | 11-month payback; 135% 3-yr ROI | 9-month payback; 170% 3-yr ROI |
| Medium breach probability (1/2 years) | 12-month payback; 120% 3-yr ROI | 10-month payback; 165% 3-yr ROI | 8-month payback; 210% 3-yr ROI |
| High breach probability (1/year) | 10-month payback; 175% 3-yr ROI | 8-month payback; 230% 3-yr ROI | 7-month payback; 280% 3-yr ROI |
⚠️ Even the most conservative scenario, with low breach probability and conservative efficiency gains, delivers positive ROI within 14 months. That is the “worst case still works” argument that earns CFO trust.
🎯 Same Data, Different Audiences
The underlying numbers do not change. The framing does:
| Stakeholder | What They Need to Hear | Metric Translation |
|---|---|---|
| CFO | NPV, payback period, cost avoidance vs. cost savings (separated) | “$828K NPV, 10-month payback. Bucket 2 is avoidance, not on the income statement but directly reduces risk exposure” |
| CEO / Board | Risk reduction as competitive positioning | “Organizations with AI SOC pay 33% less per breach (IBM 2025). Our projected exposure drops by $266K/year” |
| CTO | Operational leverage | “Same team, 5x alert coverage, 90% faster response, no additional headcount” |
| GRC / Compliance | Penalty avoidance + audit efficiency | “Automated evidence collection saves 150+ hours per audit cycle; reduces compliance penalty exposure” |
“The CISO who can demonstrate financial returns operates at a different level than the one who presents threat landscapes.”
— Mike Salas, CISO LinkedIn Post
📋 The One-Page Executive Summary Template
This is the deliverable you take to the meeting. One page, seven lines:
- Current state cost: Annual SOC spend + estimated breach exposure (annualized)
- Proposed state cost: AI SOC investment + reduced headcount/overtime
- Net annual benefit: Bucket 1 + Bucket 2 + Bucket 3 − AI SOC investment
- Payback period: Months until cumulative benefit exceeds cumulative investment
- 3-Year NPV: Discounted at company WACC
- Key assumptions: Analyst count, alert volume, breach probability tier (from sensitivity matrix), and efficiency gain estimate
- Recommended delivery model: Human-assisted AI SOC (from Q6 analysis) with vendor-agnostic architecture (from Q7 feature matrix)
The numbers do the work. If the model is honest, inclusive of hidden costs from Q8, conservative on the sensitivity range, and clearly sourced with IBM, Ponemon, and Forrester benchmarks, it will be more persuasive than any slide deck. Present the framework. Let leadership draw their own conclusion. The right answer becomes self-evident.
1. How do you calculate the ROI of an AI SOC?
We use a three-bucket formula that maps to auditable data sources inside your organization:
AI SOC ROI (%) = [(Analyst Efficiency Savings + Breach Cost Avoidance + Operational Savings) − Total AI SOC Investment] / Total AI SOC Investment × 100
-
Bucket 1 (Analyst Efficiency): Hours saved per analyst per day × fully loaded hourly cost × analyst count × 260 working days. With 8 analysts saving 4 hours/day at $48/hr, this equals ~$399K/year.
-
Bucket 2 (Breach Cost Avoidance): Annual breach probability × average breach cost × risk reduction factor. At 15% probability, $4.44M average cost, and 40% reduction, this equals ~$266K/year.
-
Bucket 3 (Operational Savings): SIEM/SOAR consolidation, reduced overtime, compliance automation, and decreased contractor spend, typically $100K–$150K.
Using a $300K annual AI SOC investment, the worked example delivers $485K net benefit, or 162% ROI. Plug in your own environment-specific numbers for each bucket, and the formula scales to any team size or threat profile.
2. What analyst efficiency metrics prove AI SOC value?
Six metrics map directly to financial ROI. We compiled benchmarks from IBM, Forrester, Ponemon, Gartner, and vendor proof-of-concept data into a single reference:
-
MTTD (Mean Time to Detect): Traditional SOC: hours to 197+ days. AI SOC: under 10 minutes.
-
MTTR (Mean Time to Respond): Traditional: 60–90 min. AI SOC: under 15 min (Forrester documents 85% reduction).
-
MTTI (Mean Time to Investigate): Traditional: 25–45 min/alert. AI SOC: ~4.3 minutes (Prophet AI healthcare PoC).
-
Cost per Alert: Manual: $15–$35. AI-automated: $1–$5.
-
False Positive Reduction: Up to 90% reduction with AI triage.
-
Analyst Force Multiplier: 3–10x capacity increase per analyst.
MTTI is the metric most buyers overlook, yet analysts spend 60–80% of their workday on investigation. Collapsing that time is what drives Bucket 1 of the ROI formula. We recommend tracking these six metrics as your AI SOC SLA benchmarks before and after deployment.
3. What is the difference between breach cost avoidance and cost savings in AI SOC ROI?
These are two fundamentally different financial categories, and conflating them is the fastest way to lose credibility with your CFO.
-
Cost savings = real dollars you stop spending. Example: AI handles alert triage, overtime drops by 60%, and that reduction shows up on the income statement.
-
Cost avoidance = dollars you never lose because an incident was prevented or contained faster. Example: your MTTD dropped from days to minutes, and you avoided a $4.44M breach. That number never appears on the income statement but directly reduces risk exposure and cyber insurance premiums.
IBM’s 2025 data shows organizations with extensive AI and automation saved $1.88M per breach. We recommend modeling avoidance separately using a three-tier scenario (conservative, moderate, aggressive breach probability) and letting leadership choose their comfort level. This separation earns CFO trust because it shows you understand how finance teams actually model risk. For a full framework, see our AI SOC provider comparison which maps these financial categories to vendor capabilities.
4. How does AI SOC ROI compare to traditional SOC and MSSP costs?
The comparison is between three economic models with fundamentally different cost curves:
-
Traditional SOC (In-House): $1.5M–$3M+/year for 24/7 coverage (8–12 analysts, shifts, benefits). Costs scale linearly with every additional unit of coverage.
-
Legacy MSSP: $500K–$1.2M/year. Outsources headcount but does not change the linear cost model. MSSPs often act as “alert forwarders,” detecting and notifying without resolving.
-
AI SOC: $200K–$600K/year (platform + 2–4 analysts). Costs scale sublinearly. Each additional alert, endpoint, or log source costs nearly nothing to process.
The cost-per-resolved-incident gap is the clearest indicator: traditional SOC runs $50–$150, MSSP runs $40–$100 (but “resolved” is debatable), and AI SOC runs $5–$20. The key insight is that MSSP cost-per-incident looks competitive until you realize your team still investigates every escalation. A vendor-agnostic MDR platform changes this by triaging, investigating, and responding, not just forwarding.
5. Should I choose a fully autonomous or human-assisted AI SOC?
For most mid-market organizations, the human-assisted model delivers higher risk-adjusted ROI. Here is why:
-
Autonomous AI SOC achieves lower per-alert cost (~$2–$8) and handles 92%+ of known alert types without human intervention. However, it carries higher platform cost, requires significant governance investment, and the cost of a single misresponse (production outage, compliance violation) can exceed an entire year’s savings.
-
Human-Assisted AI SOC has slightly higher per-incident cost (~$5–$15) but includes a “confidence gate.” AI handles 80–90% of volume autonomously; human concierge analysts review and approve response actions for the high-stakes 10–20%.
Autonomous ROI peaks for massive alert volumes on homogeneous cloud stacks with low regulatory complexity. Human-assisted ROI peaks for regulated industries, complex hybrid environments, and organizations where a single misresponse carries outsized impact. The optimal architecture for most readers is the AI + Human Ally model. We built the UnderDefense MAXI platform around this exact architecture because operational reality demands it.
6. Which AI SOC vendor features drive the most ROI?
We mapped 10 specific vendor features to their corresponding ROI levers. The top five that move the financial needle most:
-
Vendor-agnostic integration (250+ tools): Eliminates rip-and-replace costs. Protects your existing SIEM, EDR, and cloud investment. The “integration tax” of switching to a proprietary platform can reach $200K–$400K before you see any benefit.
-
Auto-triage and investigation: Collapses MTTI from 30+ minutes to under 5 minutes per alert. This directly drives Bucket 1 analyst efficiency savings.
-
Transparent, predictable pricing: Enables accurate TCO modeling. No surprise overages means your CFO can trust the projections.
-
Concierge analyst support: Adds the human confidence gate for high-stakes decisions, reducing the cost of autonomous misresponse.
-
Rapid deployment (under 30 days): Every month of delayed deployment is a month of unrealized savings.
Score any vendor against all 10 features weighted by your priority levers. Our AI SOC pricing guide maps these features to specific cost tiers across providers.
7. What hidden costs inflate AI SOC TCO and how do you avoid them?
Most AI SOC ROI projections overstate returns by 20–40% because they only count the platform subscription. The complete TCO has five layers:
-
Platform/subscription: $200K–$600K/year
-
Integration and onboarding: 40–200 hours of internal engineering ($10K–$50K+)
-
Data ingestion/storage: SIEM storage costs that may increase with AI SOC volume ($20K–$100K+)
-
Tuning and ramp period: First 90 days see 15–25% reduced efficiency
-
Governance and change management: $15K–$40K for workflows, playbooks, and training
The three hidden traps are vendor lock-in penalties ($100K–$400K+ switching costs), compliance coverage gaps (paid add-ons discovered post-signing), and escalation overload (poorly tuned AI drowning human teams). Mitigation: choose a vendor-agnostic architecture with no lock-in, verify compliance automation covers your frameworks natively, and budget for a realistic 90-day ramp period.
8. How do you present an AI SOC business case to a CFO?
The #1 reason AI SOC business cases fail is language mismatch. CISOs present MTTD and MTTR; CFOs want NPV, payback period, and sensitivity ranges. Here is the framework that gets approved:
-
Build a 3-year financial model: Year 0 investment + Years 1–3 savings across all three buckets, discounted at 8–12% WACC.
-
Present a sensitivity matrix: 3×3 grid with Low/Medium/High breach probability × Conservative/Moderate/Aggressive efficiency gains. Even the most conservative scenario should show positive ROI within 14–18 months.
-
Separate cost savings from cost avoidance: CFOs model these differently. Keeping them distinct shows financial sophistication.
-
Translate for each stakeholder: CFO gets NPV and payback. CEO/Board gets risk reduction percentage. CTO gets operational leverage (“same team, 5x coverage”). GRC gets audit efficiency and penalty avoidance.
Use a one-page executive summary: current state cost, proposed state cost, net annual benefit, payback period, 3-year NPV, key assumptions, and recommended delivery model.
The post ROI of AI in SOC: Calculate Analyst Savings and Breach Avoidance appeared first on UnderDefense.