Q1: Why Is Proving Managed SIEM ROI So Difficult, and Why Does It Matter Now?
The ROI Paradox Every Security Leader Faces
Here’s the uncomfortable truth about security budgets: your success is invisible. When nothing breaks, nobody asks what you prevented. When something does break, everyone asks why you didn’t spend more. Security is the only function where proving value requires proving a negative, and that paradox has killed more budget proposals than any CFO ever has.
I’ve sat across the table from enough CFOs to know the conversation by heart. You bring a stack of MTTD improvements and MITRE coverage scores, and they’re looking for one number: what does this save us? As GR, a CISO with 23 years at Micron and time at Darktrace, put it on a recent session with us: “The CFO or budget decision-maker is often trying to get to, how well do they trust the team? Does this make sense? Do we have the money?” That’s the human reality behind every approval.
Why Traditional ROI Thinking Falls Apart
Traditional ROI is revenue generated divided by cost. That formula works beautifully for sales tools and marketing platforms. It breaks completely for security because security is a cost-avoidance function, not a revenue generator. And the industry makes this worse: Arctic Wolf and CrowdStrike hide pricing behind “contact sales” gates, making it impossible to build a clean financial model before you’ve already committed to a vendor conversation.
❌ Legacy MSSPs compound the problem. They provide monitoring-without-intelligence, checkbox coverage that satisfies a compliance requirement but gives CFOs nothing verifiable to measure against outcomes. IBM’s 2025 Cost of a Data Breach report found that only 49% of breached organizations planned to increase security investments, down from 63% the prior year. That’s a communication gap, not a budget gap.
The Three Pillars of Modern Security ROI
The shift is straightforward: stop trying to prove revenue and start quantifying risk reduction. Modern managed SIEM ROI stands on three pillars:
- TCO comparison: What does in-house actually cost vs. managed? (Most teams undercount by 40–60%)
- ROSI calculation: Risk reduction translated into dollar savings using real breach data
- Operational metrics: MTTD, MTTR, and false positive rates translated into financial impact
This article provides the methodology, formulas, worked examples, and presentation frameworks for all three, plus models like Gordon-Loeb and FAIR that give your numbers actuarial credibility.
How UnderDefense Makes This Conversation Easier
At UnderDefense, we designed our model to make ROI provable. ✅ Published pricing ($11–15/endpoint/month) means you can build a financial model before ever talking to sales. ✅ Documented SLAs (2-minute alert-to-triage and 15-minute escalation for critical incidents) provide measurable benchmarks. ✅ 830% ROI over 3 years across our MDR client base gives you a third-party-verifiable reference point. ✅ Forever-free compliance kits (SOC 2, ISO 27001, HIPAA) eliminate a line item most competitors charge $10K–$50K/year for.
We also publish a SOC cost calculator that models in-house vs. managed costs using your real numbers, the kind of evidence-based artifact that transforms a budget request from “trust me” to “here’s the data.”
Q2: What Is the True Total Cost of Ownership for SIEM, and How Does In-House Compare to Managed?
The Build vs. Buy Decision
Mid-market companies, 100 to 2,000 employees, face this decision most acutely. Too large to ignore 24/7 monitoring. Too lean to justify building a $1.7M in-house SOC. The build vs. buy question is what drives most managed SIEM purchase decisions, and getting it wrong locks you into years of sunk cost.
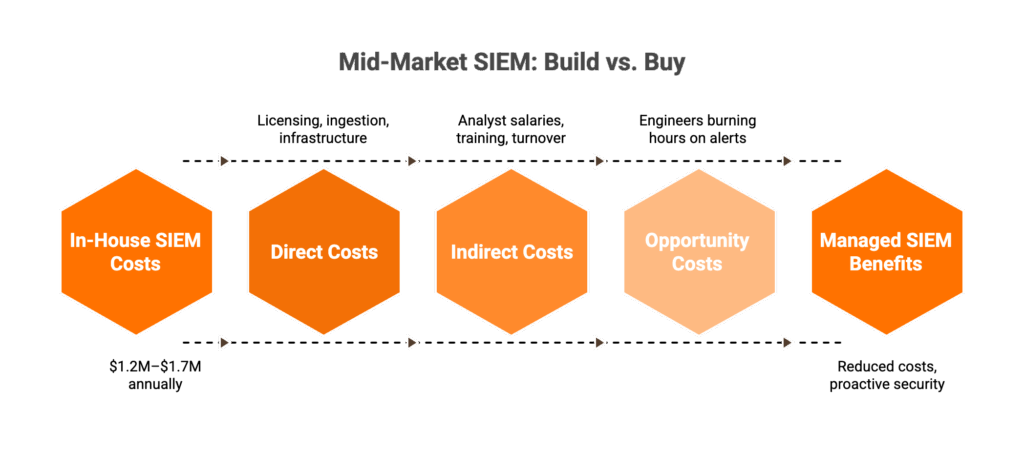
TCO isn’t just licensing. It’s three layers that most calculations miss:
💰 Direct costs: SIEM licensing, data ingestion fees, infrastructure (cloud compute, storage, and network)
💸 Indirect costs: Analyst salaries ($95K–$150K per analyst × 8–12 for 24/7 coverage), training, recruitment, turnover, and ongoing SIEM tuning and rule maintenance
⏰ Opportunity costs: Senior engineers burning hours on Tier 1 alert triage instead of risk strategy, architecture, and proactive security
Industry benchmarks put in-house SIEM at $400K–$1M+/year for tooling alone. Staff a 24/7 SOC and you’re looking at $1.2M–$1.7M annually, all-in.
In-House SOC: Strengths and Hard Limits
The strengths are real. Full control over data. Institutional knowledge that stays in-house. Custom correlation rules tuned to your business. GR made this point clearly: “When you make a vendor switch, the business logic, the correlation rules, the automation rules, that does not come with.”
But the limitations compound fast:
❌ ~35% annual SOC analyst turnover means your team is perpetually in training mode
❌ 3–6 month ramp for each new hire before they’re productive
❌ Alert fatigue degrades detection quality: 70% of SOC teams admit critical alerts get missed due to volume
❌ Compliance audit prep consumes weeks of analyst time per cycle
Managed SIEM: The UnderDefense Approach
GR’s architecture recommendation captures it: “I look for an MDR partner that will access the data where it lives. I want to control where that data lives.” That’s exactly how we built UnderDefense.
✅ Predictable OpEx ($60K–$180K/year, or $11–15/endpoint/month), no surprise ingestion fees
✅ Vendor-agnostic integration with 250+ tools, your CrowdStrike, your Splunk, your Microsoft stack stays
✅ 2-minute alert-to-triage and 15-minute escalation for critical incidents, with concierge analysts who learn your org structure, VIPs, and critical assets
✅ 30-day turnkey onboarding, not a 6-month implementation project
Side-by-Side: In-House SOC vs. Managed SIEM
| Criteria | In-House SOC | Managed SIEM (UnderDefense) |
|---|---|---|
| Annual all-in cost | $1.2M–$1.7M | $60K–$180K |
| Time to full 24/7 coverage | 3–6 months | 30 days |
| Staffing required | 8–12 FTE analysts | 0 (fully managed) |
| Tool flexibility | Vendor-locked to chosen SIEM | 250+ integrations, your stack stays |
| Response capability | Depends on team availability | 2-min alert-to-triage + active containment |
| Compliance support | Separate tools/processes | Included free (SOC 2, ISO, HIPAA kits) |
| Scalability | Linear cost increase per headcount | Elastic, predictable pricing |
| Vendor lock-in risk | Correlation rules lost on vendor switch | Customer owns all data and rules |
Who Should Choose What
Choose in-house if you have a $1.5M+ dedicated security budget, can recruit and retain 8+ SOC analysts in your market, and need fully custom correlation logic for highly regulated environments. Choose managed SIEM if you need predictable costs, instant 24/7 coverage, and want to protect existing tool investments.
As GR put it: “You have to get into the tens or hundreds of millions in revenue before you’re able to allocate headcount and staffing size for an internal security function.”
“We needed round-the-clock monitoring for compliance reasons, but building our own SOC wasn’t realistic with our budget and the current hiring market. UnderDefense fills that gap without us having to hire a full team.”
— Verified User, Marketing and Advertising, Small Business G2 Verified Review
“We received little value from ArcticWolf. The product offered little visibility when we were using it… Anything you want to look at or changes you need to make in the product must go through their engineering team.”
— Matt C., Manager, Cybersecurity Services G2 Verified Review
Q3: How Do You Calculate Return on Security Investment (ROSI) for Managed SIEM, Including Gordon-Loeb and FAIR?
The ROSI Formula: Step by Step
ROSI (Return on Security Investment) is the standard formula for monetizing risk reduction. Here’s how it works:
ROSI = (ALE × Mitigation Ratio − Solution Cost) / Solution Cost
Where:
- ALE (Annualized Loss Expectancy) = ARO (Annual Rate of Occurrence) × SLE (Single Loss Expectancy)
- Mitigation Ratio = percentage of risk the managed SIEM eliminates (typically 0.75–0.85)
- Solution Cost = annual managed SIEM investment
Worked Example: A Mid-Market Company With 500 Endpoints
| Variable | Value | Source |
|---|---|---|
| ARO (probability of significant incident/year) | 0.6 (60%) | Industry average for mid-market |
| SLE (single breach cost) | $4.44M | IBM 2025 global average |
| ALE (annualized loss expectancy) | $2.66M | ARO × SLE |
| Mitigation Ratio | 0.85 (85%) | Managed SIEM + MDR detection/response |
| Annual managed SIEM cost | $120K | Mid-range UnderDefense pricing |
ROSI = ($2.66M × 0.85 − $120K) / $120K = 1,784%
That’s roughly $18 returned for every $1 invested. For US-based organizations where the average breach cost hits $10.22M, the numbers are even more dramatic.
⚠️ For context, UnderDefense documents 830% ROI over 3 years across its MDR client base, a conservative but independently verified figure that accounts for real-world variability, not theoretical maximums.
The Gordon-Loeb 37% Rule: Are You Overspending or Underspending?
The Gordon-Loeb model (2002, University of Maryland) is widely cited in cybersecurity economics for a simple reason: it mathematically proves organizations should never spend more than 37% of expected loss to mitigate a vulnerability.
Applied to managed SIEM:
- If ALE = $2.66M, maximum justified security spend = $2.66M × 0.37 = $984K
- Managed SIEM at $120K/year = just 4.5% of ALE
💡 This framing is powerful for CFOs who think in terms of “are we overspending?” The math proves most organizations are dramatically underspending relative to their exposure. Your managed SIEM investment sits at a fraction of the economically justified ceiling, with massive headroom for additional justified spend.
The FAIR Model: When Your Board Wants Actuarial Rigor
FAIR (Factor Analysis of Information Risk) is the only international standard for cyber risk quantification and decomposes risk into a taxonomy far more granular than ROSI:
Risk = Loss Event Frequency × Loss Magnitude
Where Loss Event Frequency = Threat Event Frequency × Vulnerability, and Loss Magnitude accounts for primary and secondary losses (productivity, response, fines, and reputation).
For managed SIEM business cases, FAIR lets you model specific scenarios, ransomware, business email compromise, and insider threat, and show how managed SIEM reduces both frequency (better detection) and magnitude (faster response). Cyber insurance underwriters increasingly require FAIR-style analysis, making it a dual-purpose investment.
How UnderDefense’s Metrics Improve Every Variable
UnderDefense’s documented outcomes plug directly into these models:
- 2-minute alert-to-triage and 15-minute escalation for critical incidents reduces loss magnitude (faster containment = smaller blast radius)
- 96% MITRE ATT&CK coverage increases the mitigation ratio in ROSI
- 2-day faster detection than CrowdStrike OverWatch reduces threat event frequency in FAIR
- $2M breach prevention guarantee provides a concrete floor for loss calculations
Q4: Which Security ROI Metrics Actually Matter to Your CFO, CISO, and Board?
The Mismatched Metrics Problem
Here’s where most security leaders lose the budget conversation: they report MTTD to a CFO who needs cost-per-incident, and present MITRE coverage scores to a board that needs risk reduction in business terms. Mismatched metrics erode trust, and trust is what actually drives approvals.
GR nailed this in our podcast: “The CFO or budget decision-maker is often trying to get to, how well do they trust the team? Does this make sense?” You don’t build that trust by speaking a language your audience doesn’t understand.
The fix is straightforward: map every metric to the audience that cares about it.
The Metrics-by-Audience Matrix
| Metric | CISO (Operational) | CFO (Financial) | Board (Risk/Business) |
|---|---|---|---|
| MTTD | Target: hours, not days. Industry baseline: 241 days (IBM 2025) | Translate: each day of undetected breach = $X in expanded exposure | Frame: “We reduced detection time from weeks to hours” |
| MTTR | Target: <1 hour. UnderDefense: 2-min alert-to-triage, 15-min escalation | Translate: faster response = smaller incident cost ($4.44M average → contained losses) | Frame: “Critical threats are contained before business interruption” |
| False Positive Rate | Target: <5%. Managed SIEM with tuning: ~1% | Translate: fewer false positives = analyst hours recovered for strategic work | Frame: “Our team focuses on real threats, not noise” |
| Cost per Incident | In-house average: $18K+; managed: $2K–$5K | ⭐ Primary metric. Direct comparison of operational efficiency | Frame: “We reduced per-incident cost by 80%” |
| Security Spend as % of IT Budget | Benchmark allocation decisions | ⭐ Peer benchmark: 8–14% per Gartner. “Where do we sit?” | Frame: “We’re at X% vs. industry median of Y%” |
| Compliance Posture | Audit pass rate, certification timeline | Translate: audit prep reduced from weeks to days; cost savings quantified | ⭐ “SOC 2 certification enables $XM in enterprise pipeline” |
| Risk Reduction % | Before/after ALE comparison | Net risk reduction in dollar terms | ⭐ Primary metric. “We reduced annualized risk exposure by 75-85%” |
How Managed SIEM Moves Each Metric
The shift is measurable across every row. Managed SIEM reduces MTTD from the 241-day industry average to hours or minutes. It cuts cost-per-incident by eliminating Tier 1 staffing overhead. It compresses compliance audit preparation from weeks to days through auto-evidence collection. And it provides documented figures that boards can independently verify, not vendor promises, but auditable outcomes.
GR’s approach works here: “I use NIST CSF and allocate my budget dollars into risk families, that one-page visual can be really enlightening” for executives who need the big picture without the technical depth.
How UnderDefense Provides Metrics Across All Three Audiences
We give security leaders pre-built reporting for every audience in their approval chain:
- For the CISO: 2-minute alert-to-triage, 15-minute escalation for critical incidents, 96% MITRE ATT&CK coverage, 99% alert noise reduction via the UnderDefense MAXI platform
- For the CFO: 830% 3-year ROI, transparent pricing ($11–15/endpoint/month), SOC cost calculator for personalized comparison
- For the Board: Zero ransomware cases across all MDR clients in 6 years, compliance kits that auto-generate audit evidence, G2 Spring 2025 recognition with 12 badges
“Their expert management of our SIEM has added to the value of our security investments and tools… We love the monthly report, we gain valuable insights into security posture and incidents, and share them with the board of directors.”
— Yaroslava K., IT Project Manager G2 Verified Review
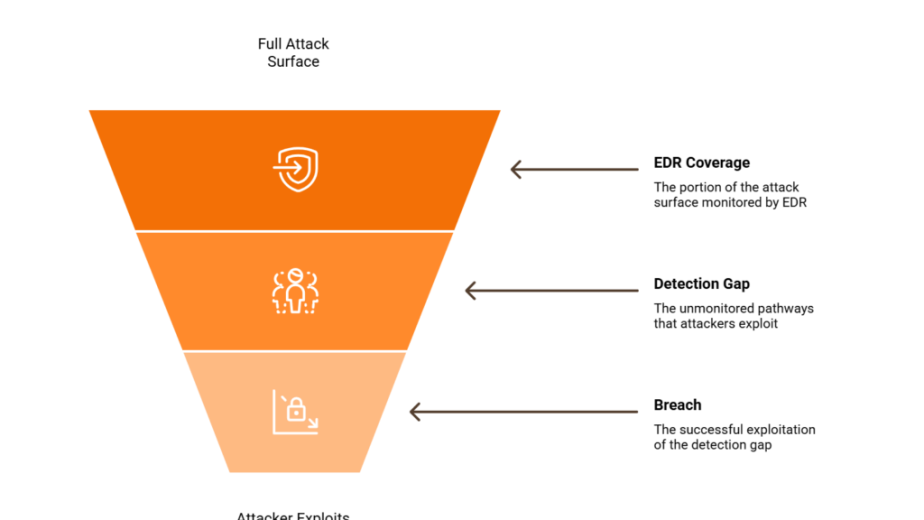
Q5: What Does It Actually Cost When You DON’T Have Managed SIEM?
The 2 AM Scenario Nobody Plans For
Picture this. A mid-market SaaS company runs a 3-person security team managing SIEM in-house. Analyst #2 resigns, alert fatigue after 14 months, well below the 18-month SOC analyst average tenure. Recruitment takes 4 months. Training takes 3 more. During the 7-month gap, a phishing-to-lateral-movement attack goes undetected for 47 days. The SIEM was running the whole time. It generated 847 alerts that week. Nobody was watching.
The breach costs $4.44M at the global average, or $10.22M if you’re a US-based company. The SIEM wasn’t the failure. The coverage model was.
⚠️ The Hidden Cost Breakdown
The root cause is not laziness or incompetence but an unsustainable operational model compounded by single points of human failure. Here’s what actually accumulates:
💸 SOC analyst turnover: 28% annually on average; 42% of leaders say staff tenure is shrinking.
💸 Replacement cost: Organizations lose approximately $1.4M annually per burned-out senior analyst through recruitment, training, and knowledge transfer.
⏰ Training ramp: 3 to 6 months before a new hire reaches productive analyst capacity.
❌ Coverage gaps during transitions: Nights and weekends are the most vulnerable, and exactly when attackers strike (as one of our cases demonstrated: “2 AM in the morning, they knocked, they were ready”).
❌ Alert fatigue degrading detection: 174 alerts per analyst daily, only 22% requiring genuine investigation. False positives consume 52% of analyst time.
❌ Opportunity cost: Senior engineers doing Tier 1 triage instead of architecture, risk strategy, and proactive security.
Organizations without 24/7 managed detection face dramatically longer dwell times. IBM’s 2025 report found the mean time to identify and contain a breach sits at 241 days, and every day of undetected presence compounds the financial damage.
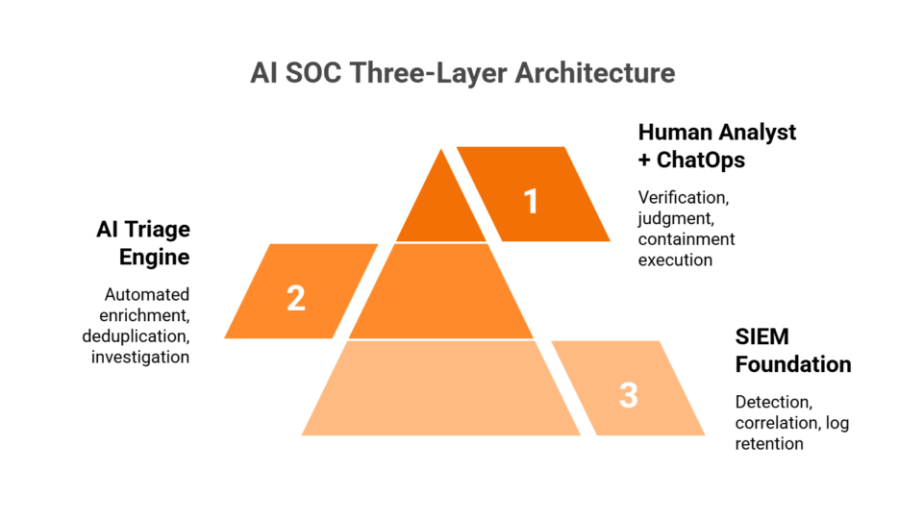
How It Should Work
A managed SIEM provider absorbs Tier 1 to 2 triage, maintains 24/7 coverage regardless of internal staffing changes, and delivers confirmed incidents, not raw alerts, to your team. Your internal team focuses on risk strategy, proactive security, and business-enabling work. Staffing changes don’t create coverage gaps. The platform gets smarter over time through detection tuning, not dumber as institutional knowledge walks out the door.
UnderDefense’s Approach: Zero Coverage Gaps
UnderDefense’s concierge analyst model means internal staffing changes never create blind spots. 24/7 monitoring continues uninterrupted with a documented 2-minute alert-to-triage and 15-minute escalation for critical incidents. The UnderDefense MAXI platform ingests from your existing stack (CrowdStrike, Splunk, Microsoft Defender, Okta, 250+ integrations), so adopting managed SIEM doesn’t mean starting over; it means your current tools finally get watched by analysts who learn your org structure, your VIPs, and your context.
“Not having to worry about ransomware, alert overload and reporting. Getting a clear view of my security posture, where the threats are coming from and how they are handled. They literally took care of all our problems.”
— Arlin O., Enterprise (1000+ emp.) UnderDefense G2 Verified Review
“Our IT team was overwhelmed by the sheer volume of security alerts and doesn’t have the resources for 24/7 monitoring.”
— Andriy H., Co-Founder and CTO at Contora Inc. UnderDefense G2 Verified Review
“Arctic Wolf provides solid detection and response capabilities, but overly relies on the client’s team for remediation, which really hurts the value of the service.”
— VP of Technology, Services Industry Arctic Wolf – Gartner Peer Review
Q6: How Does Managed SIEM Reduce Compliance Costs and Cyber Insurance Premiums?
Compliance as Revenue Enablement, Not Just Cost
Here’s a reframe most CFOs haven’t considered: compliance is not a cost center but a revenue accelerant. GR made this crystal clear in our podcast: “If I can find a clear connection between a security program and a customer, that’s where I want to be because the signal is really clear. Sometimes a customer wants to write something into the contract that means I have to go out and spend money, that’s a really easy justification because I can tie it right to revenue.”
The numbers back this up. SOC 2 certification enables access to enterprise contracts worth 3 to 10x the compliance investment. Without it, your sales pipeline stalls at the vendor security questionnaire stage. GR described this scaling challenge: “You have so many prospects and customer conversations happening that it’s driving a large number of inquiries into your security team around customer questionnaires.”
💰 The Compliance Math
Managed SIEM with auto-evidence collection transforms audit economics:
| Compliance Cost Driver | Without Managed SIEM | With Managed SIEM |
|---|---|---|
| Annual audit prep time | 120+ hours per cycle | ~20 hours per cycle |
| Staff time cost | $50K to $150K annually | $10K to $30K annually |
| Separate compliance tools (Vanta, Drata) | $10K to $50K/year | ✅ Included free with UnderDefense |
| Time to first certification | 6 to 12 months | 2 to 4 months with vCISO support |
Cyber Insurance: A Direct Cost Savings Lever
Cyber insurance underwriters now evaluate detection and response capabilities when pricing premiums, and MDR has become a prerequisite for many policies, not an optional enhancement.
A Sophos study analyzing 282 claims found that companies using MDR services had average claims of €71,828, compared to €478,850 for EDR/XDR alone and €2.87M for endpoint protection only, a 97.5% reduction in claim amounts. Lower claims translate directly into lower premiums and better policy terms.
⭐ For a company paying $100K to $300K in annual cyber insurance premiums, documented 24/7 managed detection with defined response time SLAs can drive 10 to 25% premium reductions, representing $10K to $75K in direct, recurring savings that drop straight to the managed SIEM ROI calculation.
Quantifying the Combined Impact
Quick model, a company with $200K annual insurance premium + $100K compliance staff cost + $500K enterprise pipeline blocked by missing SOC 2:
✅ Insurance savings: $30K (15% premium reduction).
✅ Compliance staff time savings: $70K.
✅ Enterprise revenue unlocked: $500K+.
💰 Managed SIEM annual cost: $120K.
Net Year 1 impact: $480K+ positive, before counting risk reduction.
This transforms the CFO conversation from “how much does security cost?” to “how much revenue and savings does security generate?”
UnderDefense’s Built-In Compliance Advantage
We include forever-free compliance kits (SOC 2, ISO 27001, HIPAA) with all MDR subscriptions, eliminating the need for separate compliance tools. Combined with the UnderDefense MAXI platform’s auto-evidence collection and documented SLAs that satisfy insurance underwriter requirements, UnderDefense covers both ROI levers in a single subscription.
Q7: How Do You Build a Business Case That Gets Your CFO and Board to Say Yes?
Step 1: Establish Your Baseline (Current State Cost)
Start by documenting all-in current SIEM spend: licensing, staffing, training, overtime, contractor and consultant fees, and compliance tool subscriptions. Most teams dramatically undercount because they forget the indirect costs.
GR’s approach from our podcast is the most effective opener: “I use NIST CSF and allocate my budget dollars into the risk families, that one-page visual can be really enlightening. I might find that I have zero money being spent in a proactive capacity.” This visualization shows CFOs where spend is concentrated and where gaps create risk exposure, a conversation starter, not a sales pitch.
Step 2: Quantify the Risk Exposure
Use ROSI and ALE calculations (from the earlier section), IBM 2025 breach cost benchmarks ($4.44M global, $10.22M US), and industry-specific data:
Healthcare: $10.93M average breach cost.
Financial services: $6.08M average breach cost.
Regulatory fines: HIPAA ($100K to $2M per violation category), GDPR (up to 4% global revenue).
Business interruption: Average $1,467/minute per Ponemon research.
💰 CFO language: “Our current detection gap exposes us to $X.XM in annualized breach risk. For $XXK/year, we reduce that exposure by 75 to 85%.”
Step 3: Build Three Financial Scenarios
| Scenario | Assumptions | 3-Year NPV |
|---|---|---|
| ⚠️ Conservative | Managed SIEM reduces breach impact by 60%; no compliance revenue | Positive ROI within Year 1 |
| ✅ Moderate | Reduces probability and impact by 75%; includes compliance savings + insurance reduction | 5 to 8x return on investment |
| ⭐ Optimistic | Full risk-adjusted return including compliance revenue enablement, insurance premiums, and analyst time recovered | 10 to 18x return on investment |
Board language: “We’re not buying a security tool, we’re purchasing a risk mitigation program that pays for itself in cost avoidance.” Frame as insurance with a provable payoff, not a technology purchase.
Step 4: Avoid These Five Business Case Killers
❌ Only counting licensing. Ignoring staffing, turnover, and opportunity costs. Fix: Include full TCO per the framework above.
❌ Using a single breach number. One scenario is easy to argue away. Fix: Present three risk-adjusted scenarios.
❌ Presenting MTTD without financial translation. Technical metrics don’t drive approvals. Fix: Convert every metric to dollars.
❌ Ignoring opportunity costs. Senior engineers doing Tier 1 triage is invisible waste. Fix: Quantify hours recovered × blended rate.
❌ Failing to include compliance revenue. SOC 2 is not a cost; it’s a pipeline unlock. Fix: Map certifications to specific enterprise deals blocked by vendor questionnaires.
UnderDefense Makes Steps 1 to 3 Easier
UnderDefense’s SOC cost calculator automatically models the full TCO comparison for Step 1. Published pricing ($11 to $15/endpoint/month) and documented SLAs eliminate the “soft numbers” CFOs reject. The 830% 3-year ROI figure and case studies provide third-party-verifiable proof points for Step 3.
Q8: What Language Gets Your Board to Approve Security Spend?
Three Rules That Change the Conversation
Boards don’t approve “SIEM investments.” They approve risk reduction programs tied to financial outcomes. Three rules: (1) Speak in dollars, not alerts. (2) Frame security as revenue protection and enablement, not an insurance cost. (3) Benchmark against breach impact and peer spend, not tool feature lists.
Four Formulations That Work
1. Lead with exposure:
“Our current detection gap exposes us to $2.66M in annualized breach risk. For context, the average US breach now costs $10.22M, a record high in IBM’s 2025 report.”
2. Present cost-benefit:
“For $120K/year in managed SIEM, we reduce that exposure by 75 to 85%, yielding an 830% 3-year ROI based on documented client outcomes across 500+ organizations.”
3. Anchor to revenue:
“SOC 2 certification, included in our managed SIEM subscription, unlocks $XM in enterprise pipeline currently blocked by vendor security questionnaires.” As GR put it: “If I can tie security spend right to revenue in a customer agreement, that’s a really easy justification.”
4. Close with peer validation:
“Companies our size allocate 8 to 14% of IT budget to security operations per Gartner benchmarks. We’re currently at X%. This proposal brings us to the median, not the leading edge.”
What to Avoid in Board Presentations
❌ Leading with technical jargon (MITRE ATT&CK coverage, detection rules, SIEM ingestion rates).
❌ Saying “we need this tool” instead of “this reduces our risk by $X.”
❌ Presenting one scenario that can be argued away. Always bring three.
❌ Asking for budget without connecting to a customer contract, audit requirement, or insurance mandate.
The board wants a single slide: here’s the risk, here’s the cost to mitigate it, here’s the payoff.
UnderDefense Provides Board-Ready Artifacts
We give security leaders the materials boards require: published pricing for financial modeling, G2/Gartner-recognized outcomes, documented case studies with named metrics (2 days faster detection than CrowdStrike OverWatch, $650K loss avoidance, zero ransomware cases across 500+ MDR clients over 6 years), and a SOC cost calculator that generates the comparison slide your CFO needs.
Q9: How Do You Track and Report Managed SIEM ROI Year Over Year?
Most security leaders can articulate why they bought a managed SIEM. Far fewer can show, with documented metrics, what it delivered in Year 1, how it compounded in Year 2, and what strategic value it unlocked by Year 3. That gap is what kills budget renewals. Here is a phased ROI tracking framework built from operational reality, not theoretical models.
📊 Year 1: Foundation & Baseline
The entire purpose of Year 1 is to establish measurable baselines and prove the managed model works. Without documented starting points, you cannot show improvement later.
KPIs to Track in Year 1
- Onboarding completion time, target: 30 days or less from contract to full 24/7 coverage.
- Initial MTTD baselines and response time baselines vs. pre-managed state (or industry average of ~207 days MTTD if no prior data exists).
- Alert volume vs. actionable incident ratio, targeting 99% noise reduction during onboarding tuning.
- Compliance readiness timeline, time to first certification achieved (ISO 27001, SOC 2, HIPAA).
- Total managed cost vs. projected in-house equivalent. Document this side-by-side for every CFO meeting.
- False positive rate. Track weekly for the first 90 days, monthly thereafter.
Expected Year 1 Outcomes
24/7 coverage gets established, baseline metrics are documented, first compliance certifications are achieved, and immediate ROI materializes from eliminated recruitment and staffing costs. The report format should be a monthly security metrics dashboard paired with quarterly business reviews that include a CFO-facing summary.
⏰ Year 2: Optimization & Compounding Returns
Year 2 is where managed SIEM ROI starts compounding, if your provider is actually tuning detection rules and building institutional knowledge about your environment.
KPIs to Track in Year 2
- MTTD improvement trends and response time improvement trends. Expect 20 to 40% improvement as detection rules mature.
- False positive reduction trajectory. Plot this monthly to show the tuning curve.
- Analyst time recovered, hours per week freed from triage, reallocated to strategic work like threat modeling.
- Detection rule maturity score: how many custom rules are active, tested, and producing confirmed offenses.
- Cyber insurance premium change at renewal. Organizations with strong security controls saw 8 to 12% premium reductions in 2025.
- Compliance audit pass rate, first vs. second audit cycle comparison.
By Year 2, expect 40 to 60% further alert noise reduction. Your security team shifts from reactive triage to proactive risk management and threat modeling. Insurance premiums should decrease at renewal. Cyber insurance rates declined 5% on average in Q4 2024 for companies investing in controls, and that trend continued through 2025.
✅ Year 3: Strategic Value Realization
Year 3 is where managed SIEM stops being a “security expense” and becomes a documented business asset.
KPIs to Track in Year 3
| Metric | What It Proves |
|---|---|
| Cumulative cost avoidance | Incidents prevented × avg. cost ($4.44M global average per IBM 2025) |
| Compliance-enabled revenue | Enterprise contracts closed because your security posture passed third-party risk reviews |
| Board-level risk score improvement | Documented reduction in organizational risk posture |
| Vendor consolidation savings | Tools replaced or retired because the managed provider covers them |
| Total 3-year ROI calculation | Full financial picture for renewal or expansion |
The core insight: managed SIEM ROI compounds as the provider builds institutional knowledge of your environment. Correlation logic deepens, detection accuracy continuously improves, and context-specific response gets faster. This is the opposite of in-house degradation from staff turnover. Every time a Tier 1 analyst quits, you lose months of environmental knowledge.
🔧 How UnderDefense Tracks This
We provide quarterly business reviews with documented metrics across all three phases. Custom detection tuning means the UnderDefense MAXI platform becomes more accurate and cost-effective over time. Our 1% customer churn rate confirms this compounding value.
The institutional knowledge we build about your org structure, VIPs, and critical assets compounds into faster, more contextual responses that no new hire could replicate. That is what 830% ROI over 3 years looks like operationally: not a single magic moment, but compounding improvements in detection accuracy, response speed, and analyst efficiency every quarter.
“They keep us informed, suggesting relevant and cost-effective security improvements and new use cases that enhance our defenses. And we love the monthly report, we gain valuable insights into security posture and incidents, and share them with the board of directors.”
— Yaroslava K., IT Project Manager UnderDefense G2 Verified Review
“With UnderDefense MAXI, we’ve reduced security breaches. Their adherence to SLAs gives me confidence in our infrastructure’s protection. As the Information Security Director, it lets me focus on strategy, knowing the day-to-day security is managed effectively.”
— Oleg K., Director Information Security ⭐ 4.5/5 UnderDefense G2 Verified Review
“UnderDefense is surprisingly affordable considering the level of protection we get. Their proactive threat hunting and rapid response have saved us from incidents that could have been incredibly costly.”
— Verified User in Program Development ⭐ 5/5 UnderDefense G2 Verified Review
Q10: Ready to Calculate Your Managed SIEM ROI? Start With Your Real Numbers
Every formula in this article works, but only when you plug in your organization’s real numbers. The fastest way to build a CFO-ready business case is to start with a personalized cost comparison using your actual endpoint count, tool stack, and staffing model.
What the SOC Cost Calculator Models for You
✅ Your in-house SOC cost (staffing, tools, training, and overhead) vs. managed alternative.
✅ Annual savings projection across Year 1 to 3.
✅ Compliance cost reduction estimate.
✅ Ready-to-present cost comparison for your next CFO meeting.
💰 No contact form required. Results delivered immediately.
Whether you are building a first-time business case or preparing for budget renewal, the calculator transforms the TCO framework from this article into a personalized financial model you can present next week.
Credibility Anchor
This analysis is grounded in IBM 2025 breach cost data ($4.44M global average, $10.22M U.S. average), documented UnderDefense client outcomes (830% 3-year ROI, 2-minute alert-to-triage SLA, 15-minute escalation for critical incidents), G2 Spring 2025 badge recognition, and operational insights from security leaders managing programs at Micron, Darktrace, and mid-market enterprises.
1. How do you calculate managed SIEM ROI using the ROSI formula?
We use the Return on Security Investment (ROSI) formula as the foundation for every managed SIEM business case we help clients build. The formula is:
ROSI = (Risk Reduction in Dollar Terms − Cost of the Solution) ÷ Cost of the Solution × 100
To apply this, you need three inputs:
-
Annual Loss Expectancy (ALE) before managed SIEM: Multiply the probability of a breach by the average cost. IBM’s 2025 data puts the global average at $4.44M per breach and $10.22M for U.S.-based organizations.
-
ALE after managed SIEM: Factor in reduced MTTD, faster containment, and 24/7 coverage. Organizations with fully deployed security AI and automation save an average of $1.76M per incident.
-
Total cost of the managed SIEM solution: Include subscription fees, onboarding, and any internal coordination overhead.
For example, if your pre-managed ALE is $2M, your post-managed ALE drops to $400K, and your managed SIEM costs $180K annually, your ROSI is 789%. We recommend running this calculation quarterly and presenting it alongside MTTD improvement trends and false positive reduction data for maximum CFO impact.
2. What is the total cost of ownership for managed SIEM vs. building an in-house SOC?
The total cost of ownership (TCO) gap between managed SIEM and in-house SOC operations is significant, and it widens every year as staffing and tooling costs increase.
In-house SIEM TCO typically includes:
-
SIEM licensing ($50K to $300K+ annually depending on data volume)
-
24/7 analyst staffing (minimum 5 to 8 FTEs at $85K to $165K each)
-
Infrastructure, training, recruitment, and turnover costs
-
Detection engineering and ongoing rule tuning
For most mid-market organizations, this totals $400K to $1M+ per year. A managed SIEM alternative typically ranges from $60K to $180K annually, delivering 24/7 monitoring, detection engineering, compliance reporting, and incident response in a single subscription.
We recommend building a side-by-side TCO comparison using your actual endpoint count and tool stack. The SOC Cost Calculator generates this analysis instantly with your real numbers, giving you a CFO-ready document without requiring a contact form.
3. What security ROI metrics should we present to the board and CFO?
Board members and CFOs do not evaluate security the same way a SOC analyst does. We have found that the most effective executive presentations organize metrics into three categories:
Financial metrics:
-
Cost avoidance (incidents prevented × average breach cost)
-
Managed SIEM cost vs. projected in-house equivalent
-
Cyber insurance premium changes at renewal
-
Vendor consolidation savings
Operational metrics:
-
Mean Time to Detect (MTTD) and response time improvement trends
-
False positive reduction trajectory
-
Alert volume vs. actionable incident ratio (targeting 99% noise reduction)
Strategic metrics:
-
Compliance-enabled revenue (contracts won because your security posture passed third-party risk reviews)
-
Board-level risk score improvement
-
Analyst time recovered and reallocated to strategic initiatives like threat modeling
We recommend a monthly security metrics dashboard paired with quarterly business reviews. The quarterly review should include a CFO-facing summary that translates operational metrics into dollar terms. If you cannot quantify it financially, the board will treat it as an expense, not an investment.
4. How long does it take to see measurable ROI from managed SIEM?
Most organizations see measurable ROI within the first 90 days of managed SIEM deployment, with compounding returns through Year 2 and Year 3.
Year 1 (Foundation): Immediate ROI materializes from eliminated recruitment costs, reduced staffing overhead, and 24/7 coverage establishment. Within 30 days of onboarding, baseline MTTD and response time metrics are documented. By the end of Year 1, first compliance certifications (ISO 27001, SOC 2, HIPAA) are typically achieved.
Year 2 (Optimization): Expect 20 to 40% improvement in detection and response times as detection rules mature. Alert noise decreases by an additional 40 to 60%. Cyber insurance premiums should decrease, as organizations with strong controls saw 8 to 12% premium reductions in 2025.
Year 3 (Strategic value): Cumulative cost avoidance, compliance-enabled revenue, and vendor consolidation savings create a full financial picture. The UnderDefense MAXI platform’s institutional knowledge compounds over time, delivering documented 830% ROI over three years across our client base, driven by continuous improvements in detection accuracy and response speed every quarter.
5. How does managed SIEM reduce cyber insurance premiums?
Cyber insurance underwriters increasingly evaluate an organization’s security controls posture when setting premiums. Managed SIEM directly addresses the criteria insurers care about most: 24/7 monitoring, documented incident response capabilities, detection and response times, and compliance certifications.
Here is how managed SIEM influences premiums:
-
Demonstrated 24/7 coverage: Insurers verify whether you have continuous monitoring. Managed SIEM satisfies this requirement without the cost of building an internal 24/7 SOC.
-
Documented MTTD and response times: Faster detection and containment directly reduces breach severity, which lowers the insurer’s risk calculation.
-
Compliance certifications: Achieving SOC 2, ISO 27001, or HIPAA through your managed SIEM provider’s compliance services signals operational maturity.
-
Incident history and response evidence: Audit-ready logs and investigation documentation demonstrate due diligence.
Organizations investing in security controls saw cyber insurance rates decline 5% on average in Q4 2024, with 8 to 12% premium reductions reported in 2025 for companies with strong, documented controls. We recommend tracking premium changes at each renewal cycle and including the delta in your annual ROI reporting to the board.
6. What is the difference between managed SIEM and in-house SIEM for ROI purposes?
The ROI profiles of managed SIEM and in-house SIEM diverge significantly due to structural differences in how costs compound and how institutional knowledge is retained.
In-house SIEM ROI challenges:
-
High upfront capital expenditure (licensing, infrastructure, professional services)
-
Ongoing staffing costs that increase with turnover. The average Tier 1 analyst tenure is 18 months, and every departure erases months of environmental knowledge.
-
Detection rules degrade without continuous tuning, creating a “quiet failure” where the SIEM runs but stops catching real threats
-
Compliance reporting is manual and resource-intensive
Managed SIEM ROI advantages:
-
Predictable operational expenditure with no hidden staffing or infrastructure costs
-
Institutional knowledge compounds as the provider learns your environment, VIPs, and critical assets
-
Detection accuracy improves continuously through rule tuning and correlation logic deepening
-
Compliance automation generates audit-ready evidence without separate tooling
The critical insight is that in-house SIEM ROI often degrades over time due to staff turnover and detection drift, while managed SIEM ROI compounds. This is why we recommend documenting SOC metrics monthly in Year 1 and plotting improvement trends quarterly for the most accurate comparison.
7. How do you build a managed SIEM business case that gets CFO approval?
A CFO-ready managed SIEM business case requires four components, and we have seen each one make or break budget approval:
1. Side-by-side cost comparison: Document your projected in-house SOC cost (staffing, tools, training, overhead) vs. the managed alternative. Use real numbers from your organization, not industry averages. The SOC Cost Calculator generates this instantly using your actual endpoint count and staffing model.
2. Risk-adjusted financial impact: Calculate your Annual Loss Expectancy using the ROSI formula. Multiply breach probability by average cost ($4.44M globally per IBM 2025), then show the reduction a managed SIEM delivers through faster detection and 24/7 coverage.
3. Year 1 to 3 projection: Show how ROI compounds. Year 1 delivers baseline coverage and eliminated staffing costs. Year 2 delivers 20 to 40% improvement in detection speed and insurance premium reductions. Year 3 delivers cumulative cost avoidance, compliance-enabled revenue, and vendor consolidation savings.
4. Ongoing reporting commitment: Commit to monthly security metrics dashboards and quarterly business reviews. CFOs approve renewals when they see documented improvement, not when they hear promises. Present metrics in financial terms: dollars saved, incidents prevented, hours recovered.
8. Can managed SIEM replace multiple security tools and reduce total tool spend?
Yes, vendor consolidation is one of the most underappreciated ROI drivers of managed SIEM. Most mid-market organizations accumulate 5 to 15 security tools over time, many of which overlap in functionality or go underutilized because the internal team lacks capacity to operate them all effectively.
A comprehensive managed SIEM provider can replace or retire:
-
Standalone log management platforms
-
Separate compliance and audit tools (replacing products like Vanta or Drata)
-
Basic threat intelligence feeds
-
Alert triage and ticketing systems
-
External attack surface monitoring tools
The UnderDefense MAXI platform integrates with over 250 existing security tools, meaning we work with what you already own rather than forcing replacement. At the same time, redundant tools naturally get retired as the managed platform absorbs their functions.
We recommend tracking vendor consolidation savings as a Year 3 KPI. Document every tool that gets retired or downgraded because the managed provider covers its function, and include those savings in your total 3-year ROI calculation. For organizations spending $100K to $300K annually on fragmented tools, consolidation alone can offset 30 to 50% of the managed SIEM subscription cost.
The post Managed SIEM ROI: The 3-Year Framework CFOs Actually Approve appeared first on UnderDefense.